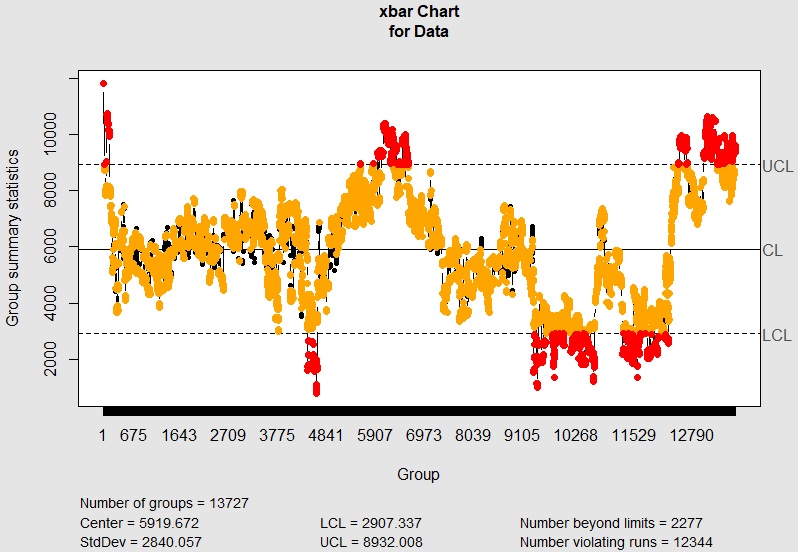
Control Chart and Process capability are used to analyze the stability. They are famous method in the quality control in manufacturing.
First row is not the names of columns. First row is the first sample data.
Static values are calculated for each row. Same row is the same group.
First row is not the names of column.
Data should be in only in the first column.
First row is not the names of column.
First column is the number of NG. Second column is the number of the group.
First row is not the names of column.
First column is the number of defcts. Second column is the number of the group.
First row is not the names of column.
First column is the number of defcts.
First row is not the names of columns.
Multi variable data.
Numbers of each row must be same.
Newdata <- 1 # If 'Newdata > 2', data behind the row is used as test data.
Control_chart_type <- "xbar" # xbar, R, S, xbar.one, p, np, u, c, T2 are avelable
setwd("C:/Rtest") # Set the directory of data file
if(Control_chart_type == "T2"){
Data <- read.csv("Data.csv", header=T) # Read data
} else {
Data <- read.csv("Data.csv", header=F) # Read data
}
library(qcc)
if(Newdata < 2){
if(Control_chart_type == "p" ||Control_chart_type == "np" ||Control_chart_type == "u"){
q1 <- qcc(Data[,1],sizes=Data[,2], type=Control_chart_type)
} else if(Control_chart_type == "c"){
q1 <- qcc(Data[,1], type=Control_chart_type)
} else if(Control_chart_type == "T2"){
q1 <- mqcc(Data, type=Control_chart_type)
} else {
q1 <- qcc(Data,type=Control_chart_type)
}
} else {
if(Control_chart_type == "p" ||Control_chart_type == "np" ||Control_chart_type == "u"){
q1 <- qcc(Data[1:Newdata-1,1],sizes=Data[1:Newdata-1,2], type=Control_chart_type, newdata=Data[Newdata:nrow(Data),1], newsizes=Data[Newdata:nrow(Data),2])
} else if(Control_chart_type == "c"){
q1 <- qcc(Data[1:Newdata-1,1], type=Control_chart_type, newdata=Data[Newdata:nrow(Data),1])
} else if(Control_chart_type == "T2"){
q1 <- mqcc(Data[1:Newdata-1,], type=Control_chart_type, newdata=Data[Newdata:nrow(Data),])
} else {
q1 <- qcc(Data[1:Newdata-1,],type=Control_chart_type, newdata=Data[Newdata:nrow(Data),])
}
}
summary(q1)
if(Control_chart_type == "xbar"){
process.capability(q1, spec.limits=c(LSL,USL),target = Target)
}
if(Control_chart_type == "xbar.one"){
process.capability(q1, spec.limits=c(LSL,USL),target = Target)
}
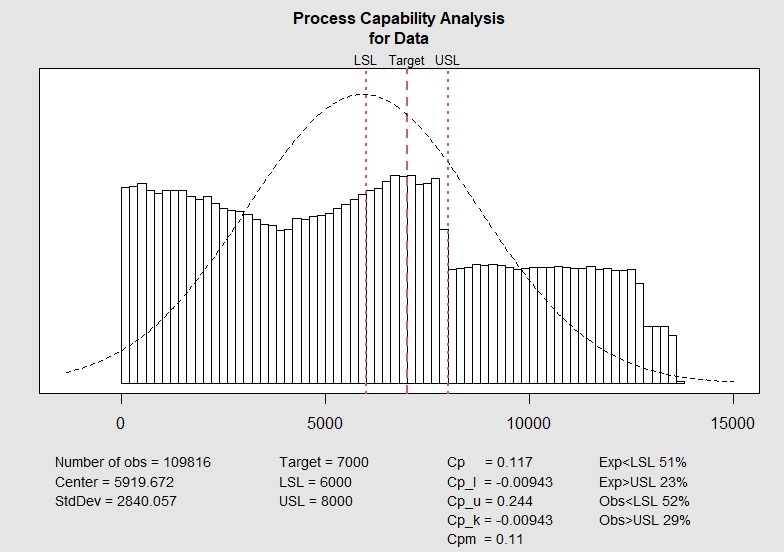
Process capability analysis is available for xbar and xbar.one.
LSL <- "" # Used in process capability analysis in xbar and xbar.one
USL <- "" # Used in process capability analysis in xbar and xbar.one
Target <- "" # Used in process capability analysis in xbar and xbar.one
if(Control_chart_type == "xbar"){
process.capability(q1, spec.limits=c(LSL,USL),target = Target)
}
if(Control_chart_type == "xbar.one"){
process.capability(q1, spec.limits=c(LSL,USL),target = Target)
}